Resilience and perfection of reactive polymer networks in polyurethane foam
Abstract: the relationship between the network parameters and resilience of polyurethane foam polymer was studied.Based on the reaction parameters obtained from literature and experiment, the simulation experiment of reactive network is established.The relative activity of hydroxyl groups in epoxybutane was estimated by comparing the simulated results with the experimental results.It was found that the hydroxyl groups of epoxy butane and propylene oxide had little activity for isocyanate, and the conversion of NCO was only 91% - 96% at the end of the reaction.It is also found that the springback foam has a shorter elastic effective chain and a higher sol fraction.
1. introduction
Viscoelastic memory foam is one of shape memory materials and is widely used in mattress development.With the increasing use of compression packaging, shape memory research becomes very important. When foam mattresses are opened at room temperature, the time of mattress recovery is an important parameter.This report describes and discusses the difference between stress and strain recovery time, and introduces a better method for measuring recovery time.The conversion rate of NCO was estimated by comparing the experimental sol fraction with the simulated sol fraction.
2. Results and discussion
2.1 Tensile recovery time and extrusion test
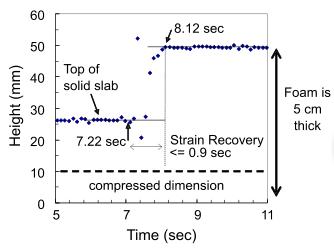
To understand the memory effect.For this purpose, PAPRA height sensor is used to detect foam size recovery.Figure 1, the recovery time of the test foam is about 0.9 s.
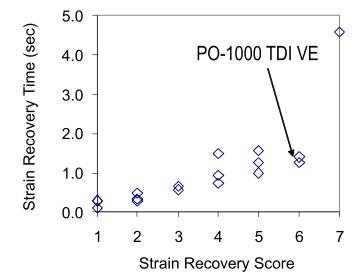
We decided to use the strain recovery time method to measure the resilience of foam, and the test scores ranged from 1 to 7.As shown in Fig. 2, the PO-1000TDI viscoelastic foam is 6 points.The slowest rebound foam is low index foam, and the overall performance is poor, which is 7 points.TDI super soft foam is 2 points.
2.2 correlation between stress recovery time and strain recovery time
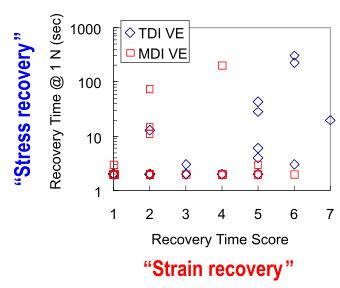
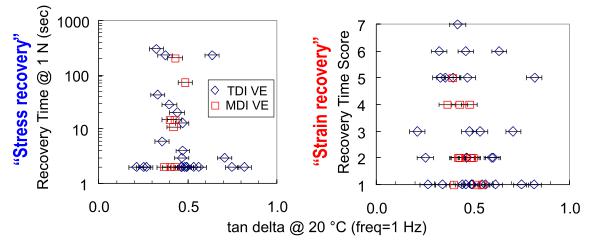
We analyzed the correlation between stress recovery time and strain recovery score, as shown in Figure 3.Using TDI based and MDI based foams, it is obvious that the stress recovery time can not be used to evaluate bubble bubble resilience because there is no obvious correlation between stress recovery time and strain recovery score.
2.3 relationship between strain recovery time and loss
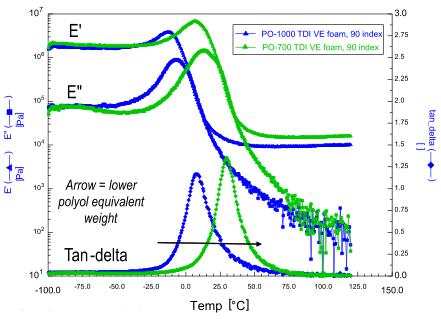
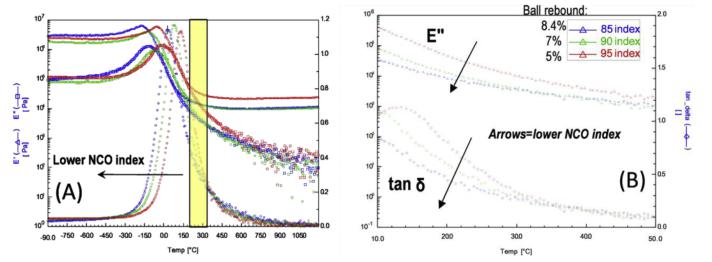
A dynamic mechanical analysis experiment was carried out to compare the viscoelasticity of PO-700 and PO-1000 TDI foam at the same ester number. It was found that the springback of PO-700 foam was much slower.It is found in Figure 4 that the loss angle of PO-700 viscoelastic foam is much higher than that of PO-1000.
In the study of PO-1000TDI based viscoelastic foam series, the TDI ester number varied from 85 to 95, and the strain recovery rate was low.As shown in Figure 5, low ester number leads to low loss angle and springback can be observed, indicating that the slow rebound foam has a lower loss angle.
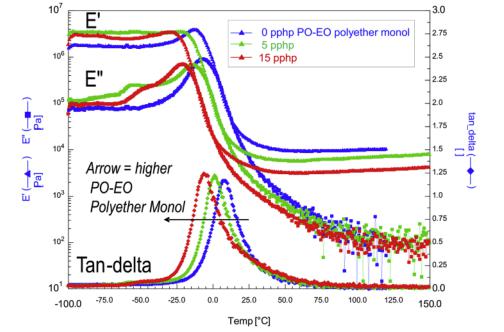
The addition amount of po-eo-520 polyether polyol was changed without changing the number of esters.The high content of polyether monomer leads to the slow rebound behavior.Figure 6 shows that the high content of polyether monoalcohol in the formula leads to low loss angle, which indicates that slow rebound corresponds to low loss angle.
Figures 4, 6 and 7 show that the correlation between loss angle and strain recovery time can be positive or negative, depending on the formulation parameters.The sample in Figure 3 further verifies this conclusion, and the results are shown in Figure 7.Obviously, there is no correlation from the graph.
2.4Relationship between network perfection and foam viscoelasticity
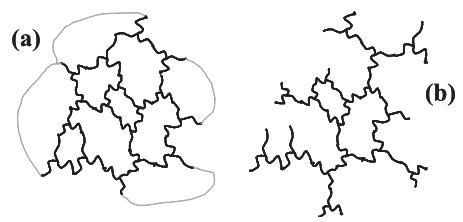
In order to further understand the driving factors of slow springback, the effect of polymer network in viscoelastic memory foam is studied, as shown in Figure 8.If a polymer network is not as ideal as Fig. 8a, but becomes more imperfect with more and more catenaries, as shown in Fig. 8b, one would expect a better viscoelastic reaction from the material.This can be achieved even when the loss value is very low.If this is the case, the results seen in figures 5 and 6 can be explained.
2.5Conversion of NCO in viscoelastic foam
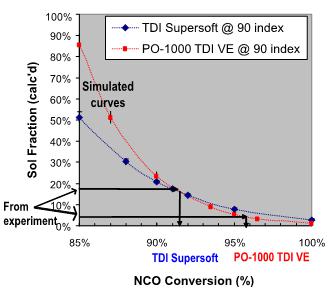
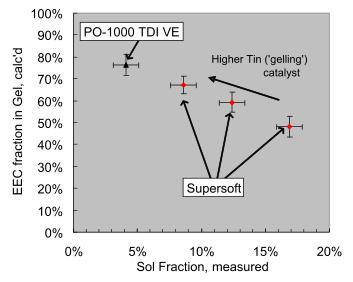
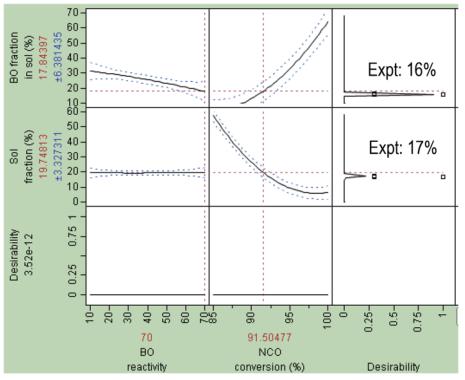
As shown in Figure 9, high NCO conversion resulted in high gel fraction and predicted a decrease in sol fraction.Using the sol component determined experimentally, we find that the NCO conversion rate of TDI super soft foam is 91-92% while that of PO-1000TDI viscoelastic foam is ~96%.
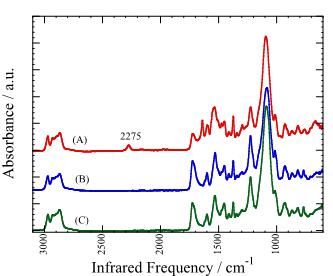
It is believed that any residual isocyanate can be observed on the foam, while NCO is obviously less than 100%.In FIG. 10, there is no N-C-O asymmetric peak at 2263-2275cm-1.The side reaction may be responsible for the reaction of residual isocyanate, but we are quite sure that biuret or urea formate are not formed, because these cross-linking reactions will lead to the decrease of sol fraction.It is probably because the residual isocyanates react with the water from the environment, and this does not exist in the original formulation of the foam.At this point, we accept a concept that the NCO conversion of a viscoelastic memory foam system will be less than 100%.
2.6 elastic effective chain fraction and sol
The simulation parameters are shown in the appendix.In the foam system, the high fraction of the dangling chain in the polymer network, that is, the low elastic chain fraction, will deviate from the ideal rubber, much more like the viscoelastic solid.In FIG. 11, we calculated the elastic chain fraction from the simulation and the sol fraction from the experiment.The lower value of the Y axis means that the foam rebound is good.Comparing PO-1000TDI viscoelastic and TDI super soft viscoelastic foam, it is found that the TDI super soft viscoelastic chain fraction is lower.However, the hand pressure test showed that the score of TDI super soft viscoelastic foam was 2, while that of PO-1000TDI was 6, that is to say, TDI super soft springback was very fast.
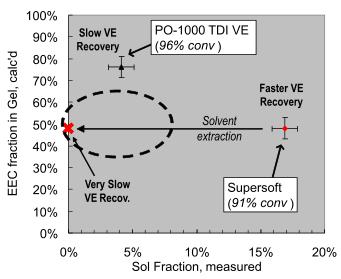
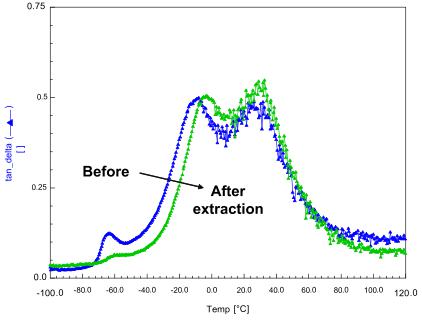
As shown in FIG. 11, TDI super soft viscoelastic foam is recovered within 7 range after solvent extraction.The possible answer is that the TDI super soft foam has plasticizing effect.It is found in FIG. 12 that although the low gas flow can cause the traditional flexible foam to recover slowly through the so-called "Qigong effect", it does not need to start the recovery of slow shape memory foam.In other words, the memory effect can be reconstructed by polymer properties.
The reason why the super soft foam springback is fast is the high sol content of the material.Therefore, try to reduce the sol content in the formula.More specifically, by using more "gel" catalyst load to achieve higher NCO conversion, the result is shown in Figure 13.It is found that the sol fraction decreases with increasing the amount of stannous octanoate.Although the effective chain fraction increased, it was still lower than the PO-1000TDI foam.The addition of 0.1pphp stannic octanoic acid to the foam is slower than that of PO-1000TDI foam.
3. Reactive network simulation
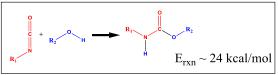
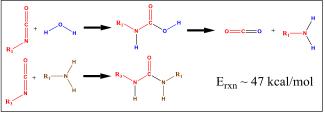
As shown in Fig. 1a, the reaction process is estimated according to the isocyanate functional groups present in the reaction mixture.
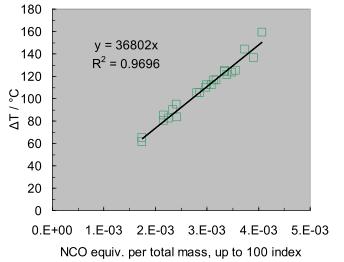
As shown in Figure A2, observe whether the temperature / isocyanate equivalent linear hypothesis holds.
| name | Equivalent / g · mol-1 | Functional group | type |
| PO-1000 | 336 | 3 | Propylene oxide |
| PO-700 | 236 | 3 | Propylene oxide |
| PO-3000 | 994 | 3 | Propylene oxide / ethylene oxide (8% ethylene oxide) |
| High molecular weight EO polyols | 1800 | 6.9 | Propylene oxide / ethylene oxide (75% ethylene oxide) |
| EO-620 | 208 | 3 | ethylene oxide |
| PO-EO-520 | 520 | 1 | Propylene oxide / ethylene oxide (50% ethylene oxide) |
| BO-40000 | -4000 | 1 | Epoxybutane |
| TDI-80 | 87.1 | 2 | 80/20 (2,4 - / 2,6-toluene diisocyanate) |
Table 2 Catalyst
| name | chemical composition | additional |
| Nexcat uc-a1 amine catalyst | 30% dipropylene glycol, 70% bis (n, N-dimethylaminoethyl) ether | Amine foaming catalyst |
| Nexcat uc-a33 amine catalyst | 33% triethylenediamine, 67% dipropylene glycol | Amine gel catalyst |
| Nexcat uc-t9 tin catalyst | 2-Stannic Ethylhexanoate (Ⅱ) | Strong gel catalyst |
| component | PO-1000TDI viscoelastic foam | Super soft TDI viscoelastic foam |
| PO-1000 | 95 | 55 |
| PO-3000 | 10 | |
| EO-620 | 25 | |
| High molecular weight EO polyols | 5 | |
| BO-4000 | 10 | |
| water | 1.25 | 1.25 |
| RETé Uf-6680 silicone oil | 0.9 | 0.9 |
| Nexcat uc-a1 amine catalyst | 0.15 | 0.15 |
| Nexcat uc-a33 amine catalyst | 0.30 | 0.20 |
| Nexcat uc-t9 tin catalyst | 0.03 | 0 |
| Total polyols | 102.6 | 102.5 |
| isocyanate index | 90 | 90 |
| TDI-80 | 33.3 | 32.1 |
| sample | Maximum temperature / ℃ | ΔT/℃ | Weight of isocyanate | category | Total mass | Ester number | Ester equivalent | Ester equivalent per unit | Per ester equivalent (100 parts) | Ester content |
| A | 110 | 80 | 345.5 | PMDI | 1200 | 85 | 2.5977 | 2.16E-03 | 2.16E-03 | 28.8% |
| B | 112 | 82 | 359.8 | PMDI | 1200 | 90 | 2.7054 | 2.25E-03 | 2.25E-03 | 30% |
| C | 120 | 90 | 373.6 | PMDI | 1200 | 80 | 2.8091 | 2.34E-03 | 2.34E-03 | 31.1% |
| D | 115 | 85 | 345.5 | PMDI | 1200 | 85 | 2.5980 | 2.16E-03 | 2.16 E-03 | 28.8% |
| E | 146 | 116 | 327.9 | T-80 | 1200 | 96 | 3.7649 | 3.14E-03 | 3.14E-03 | 27.3% |
| F | 146 | 116 | 332.9 | T-80 | 1200 | 98 | 3.8215 | 3.18E-03 | 3.18E-03 | 27.7% |
| G | 135 | 105 | 293.8 | T-80 | 1200 | 90 | 3.3729 | 2.81E-03 | 2.81E-03 | 24.5% |
| H | 142 | 112 | 315.3 | T-80 | 1209 | 98 | 3.6201 | 2.99E-03 | 2.99E-03 | 26.1% |
| J | 135 | 105 | 299.7 | T-80 | 1200 | 90 | 3.4405 | 2.87E-03 | 2.87E-03 | 25% |
| K | 142 | 112 | 325.7 | T-80 | 1202 | 100.5 | 3.7394 | 3.11E-03 | 3.10E-03 | 27% |
| L | 153 | 123 | 196.8 | T-80 | 600 | 108 | 3.2598 | 3.77E-03 | 3.49E-03 | 30.4% |
| M | 155 | 125 | 181.2 | T-80 | 584 | 99.5 | 3.0801 | 3.56E-03 | 3.56E-03 | 31% |
| N | 151 | 121 | 169.6 | T-80 | 573 | 93 | 1.9471 | 3.40E-03 | 3.40E-03 | 29.6% |
| S | 155 | 125 | 56.6 | T-80 | 162 | 120 | 0.6498 | 4.01E-03 | 3.34E-03 | 29.1% |
| T | 174 | 144 | 68.2 | T-80 | 175 | 120 | 0.7830 | 4.48E-03 | 3.74E-03 | 32.5% |
| U | 189 | 159 | 79.9 | T-80 | 188 | 120 | 0.9173 | 4.89E-03 | 4.08E-03 | 35.5% |
| V | 154 | 124 | 56.6 | T-80 | 162 | 120 | 0.6498 | 4.02E-03 | 3.35E-03 | 29.2% |
| W | 91 | 62 | 15.5 | T-80 | 116 | 100 | 0.1777 | 1.53E-03 | 1.53E-03 | 13.3% |
| X | 113 | 83 | 25.1 | T-80 | 127 | 100 | 0.2887 | 2.27E-03 | 2.27E-03 | 19.8% |
| Y | 167 | 137 | 54.2 | T-80 | 159 | 100 | 0.6218 | 3.91E-03 | 3.91E-03 | 34% |
| component | Mass moles (g / mol) | A | B | C | D | E | F | G | H | J | K |
| PO-1000 | 336 | 42 | 42 | 10 | 42 | 59.2 | 59.2 | 95 | 95 | 55 | 55 |
| PO-700 | 236 | 27 | |||||||||
| PO-D-425 | 216 | 15 | |||||||||
| PO-D-1000 | 508 | 10 | 10 | 10 | 10 | 10 | |||||
| PO-3000 | 994 | 10 | 10 | 10 | 10 | 10.8 | 10.8 | ||||
| Polymer EO polyol | 1800 | 36 | 36 | 36 | 36 | 5 | 5 | ||||
| EO-620 | 208 | 28 | 28 | 25 | 25 | ||||||
| BO-4000 | 4000 | 2 | 2 | 2 | 2 | 2 | 2 | 10 | 10 | ||
| water | 9.0077 | 1.73 | 1.73 | 1.73 | 1.73 | 1,25 | 1.25 | 1.25 | 1.25 | 1.25 | 1.25 |
| RETé UF-6180 | 0.6 | 0.6 | 0.6 | 0.6 | 0.9 | ||||||
| RETé UF-6680 | 0.9 | 0.9 | 0.9 | 0.9 | 0.9 | ||||||
| NEXCAT UC-A1 | 0.2 | 0.2 | 0.2 | 0.2 | 0.15 | 0.15 | 0.15 | 0.15 | 0.15 | 0.15 | |
| NEXCAT UC-A33 | 0.13 | 0.13 | 0.13 | 0.13 | 0.2 | 0.2 | 0.3 | 0.3 | 0.2 | 0.2 | |
| NEXCAT UC-T9 | 0.0163 | 0.0163 | 0.0163 | 0.04 | 0 | 0 | 0 | 0.05 | 0 | 0 | |
| TDI-80 | 87.06 | 38.5 | 39.4 | 33.3 | 36.2 | 34.1 | 38.1 | ||||
| PMDI | 133 | 41.5 | 44.0 | 46.4 | 41.5 | ||||||
| Isocyanate index | 85 | 90 | 80 | 85 | 96 | 98 | 90 | 98 | 90 | 100.5 |
| component | Mass moles (g / mol) | L | M | N | O | P | Q | R |
| PO-3000 | 994 | 100 | 100 | 100 | 100 | 100 | 100 | 100 |
| water | 9.077 | 4 | 4 | 4 | 1 | 2 | 3 | 5 |
| RETé UF-1322 | 0.6 | 0.6 | 0.6 | 0.6 | 0.6 | 0.6 | 0.6 | |
| BLV | 0.15 | 0.15 | 0.15 | 0.15 | 0.15 | 0.15 | 0.15 | |
| NEXCAT UC-T9 | 0.2 | 0.2 | 0.2 | 0.2 | 0.2 | 0.2 | 0.2 | |
| TDI-80 | 87.06 | 51.24 | 47.20 | 44.12 | 19.91 | 30.35 | 40.79 | 61.68 |
| index | 108 | 99.5 | 93 | 108 | 108 | 108 | 108 |
| component | S | T | U | V | W | X | Y |
| Po-1000 | 100 | 100 | 100 | ||||
| BO-4000 | 100 | 100 | 100 | ||||
| water | 4.1 | 5.1 | 6.1 | 4.1 | 1 | 2 | 3 |
| Q2-5160 | 1.0 | 1.1 | 1.2 | unknown | unknown | unknown | |
| RETé UF-5880 | 1.0 | unknown | unknown | unknown | |||
| BL-13 | 0.057 | unknown | unknown | unknown | |||
| NEXCAT UC-A33 | 0.038 | unknown | unknown | unknown | |||
| B264 | 0.12 | 0.11 | 0.10 | unknown | unknown | unknown | |
| NEXCAT UC-T9 | 0.163 | 0.18 | 0.23 | Value is not available | unknown | unknown | unknown |
| TDI-80 | 56.6 | 68.2 | 79.9 | 56.6 | 20.2 | 30.8 | 62.7 |
| Ester number | 120 | 120 | 120 | 120 | 110 | 110 | 110 |
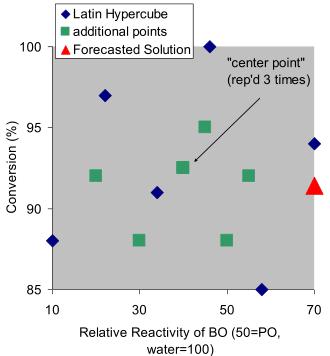
| number | Epoxybutane | NCO(%) | Content of epoxy butane in sol (%) | Gel fraction (%) | Sol ratio (%) |
| 1 | 22 | 97 | 63.2 | 93.0 | 7.7 |
| 2 | 34 | 91 | 28.8 | 82.7 | 18.0 |
| 3 | 70 | 94 | 30.1 | 91.0 | 9.8 |
| 4 | 46 | 100 | 68.5 | 97.0 | 3.7 |
| 5 | 58 | 85 | 11.9 | 48.2 | 52.2 |
| 6 | 10 | 88 | 22.2 | 69.2 | 31.3 |
| 7 | 45 | 95 | 40.4 | 92.0 | 8.7 |
| 8 | 55 | 92 | 27.8 | 86.1 | 14.6 |
| 9 | 50 | 88 | 17.1 | 70.0 | 30.6 |
| 10 | 50 | 88 | 118.6 | 70.0 | 30.6 |
| 11 | 30 | 92 | 37.6 | 84.9 | 15.8 |
| 12 | 20 | 92.5 | 32.3 | 86.8 | 13.9 |
| 13 | 40 | 92.5 | 29.8 | 86.9 | 13.8 |
| 14 | 40 | 92.5 | 33.1 | 86.9 | 13.8 |
4. Conclusion
It is found that there is no correlation between stress recovery time and strain recovery time.The comparison between PO-700 and PO-1000TDI viscoelastic foam shows that the high Tg foam rebound is slow.The results show that the network is imperfect and the resilience is slow, independent of TG.In studying a large number of memory foam, it is found that loss angle is not a reliable predictor of strain recovery time.A comprehensive method is used to evaluate the imperfections of reactive polyurethane networks by simulation and experiment. The analysis of PO-1000TDI viscoelasticity and TDI super soft viscoelastic foam shows that although the imperfect network can lead to slow rebound, the high sol fraction in foam will cause solid partial plasticization in foam and accelerate springback.The results show that, combined with the analysis and Simulation of sol fraction, polyether polyether hydroxyl end group has a similar reaction with isocyanate, and the functional group conversion of isocyanate is obviously lower than 100%, which is of great significance for the study of network defect degree.